Independent portfolio project · 2023
Sales tell one story.
Profit tells another.
A four-year view of retail sales, profitability, and product performance—built to make the next business question easier to ask.
01The business question
Which regions and products drive performance—and where might growing sales hide weak profitability? This project explores the sample Superstore retail dataset to understand revenue, profit, geographic performance, and seasonal patterns.
The intended audience is a retail manager deciding where to investigate margins, focus merchandising, or prepare for changing demand.
02Data & approach
The repository contains 9,994 order-line records spanning 2014–2017, with fields covering orders, customers, products, regions, sales, discounts, and profit. The dataset includes 793 distinct customers.
- Prepare in Excel. Organize and inspect the source data before analysis.
- Explore with SQL. Aggregate sales and profit by product, region, and time period to compare performance at multiple levels.
- Visualize in Tableau. Bring the findings together in a dashboard with annual and quarterly views.
- Explain the findings. Publish a walkthrough connecting the analysis to practical business questions.
03What the data shows
Total sales across the sample dataset.
Total profit. Strong sales alone do not explain margin performance.
The West leads on sales and profit. It accounts for approximately $725.5K in sales and $108.4K in profit, ahead of the other regions in this dataset. Regional totals provide a starting point for investigating differences in product mix and discounting.
Some categories lose money despite generating sales. Tables, Bookcases, and Supplies have negative aggregate profit. Tables are the largest of those losses, at approximately $17.7K.
| Product subcategory | Total profit |
|---|---|
| Tables | −$17,725.59 |
| Bookcases | −$3,472.56 |
| Supplies | −$1,188.99 |
Timing matters. The published analysis identifies stronger fourth-quarter sales, making seasonal demand another useful dimension for inventory and campaign planning.
Figures above were checked against the CSV retained in the project repository. Currency totals are rounded where indicated.
04The deliverable
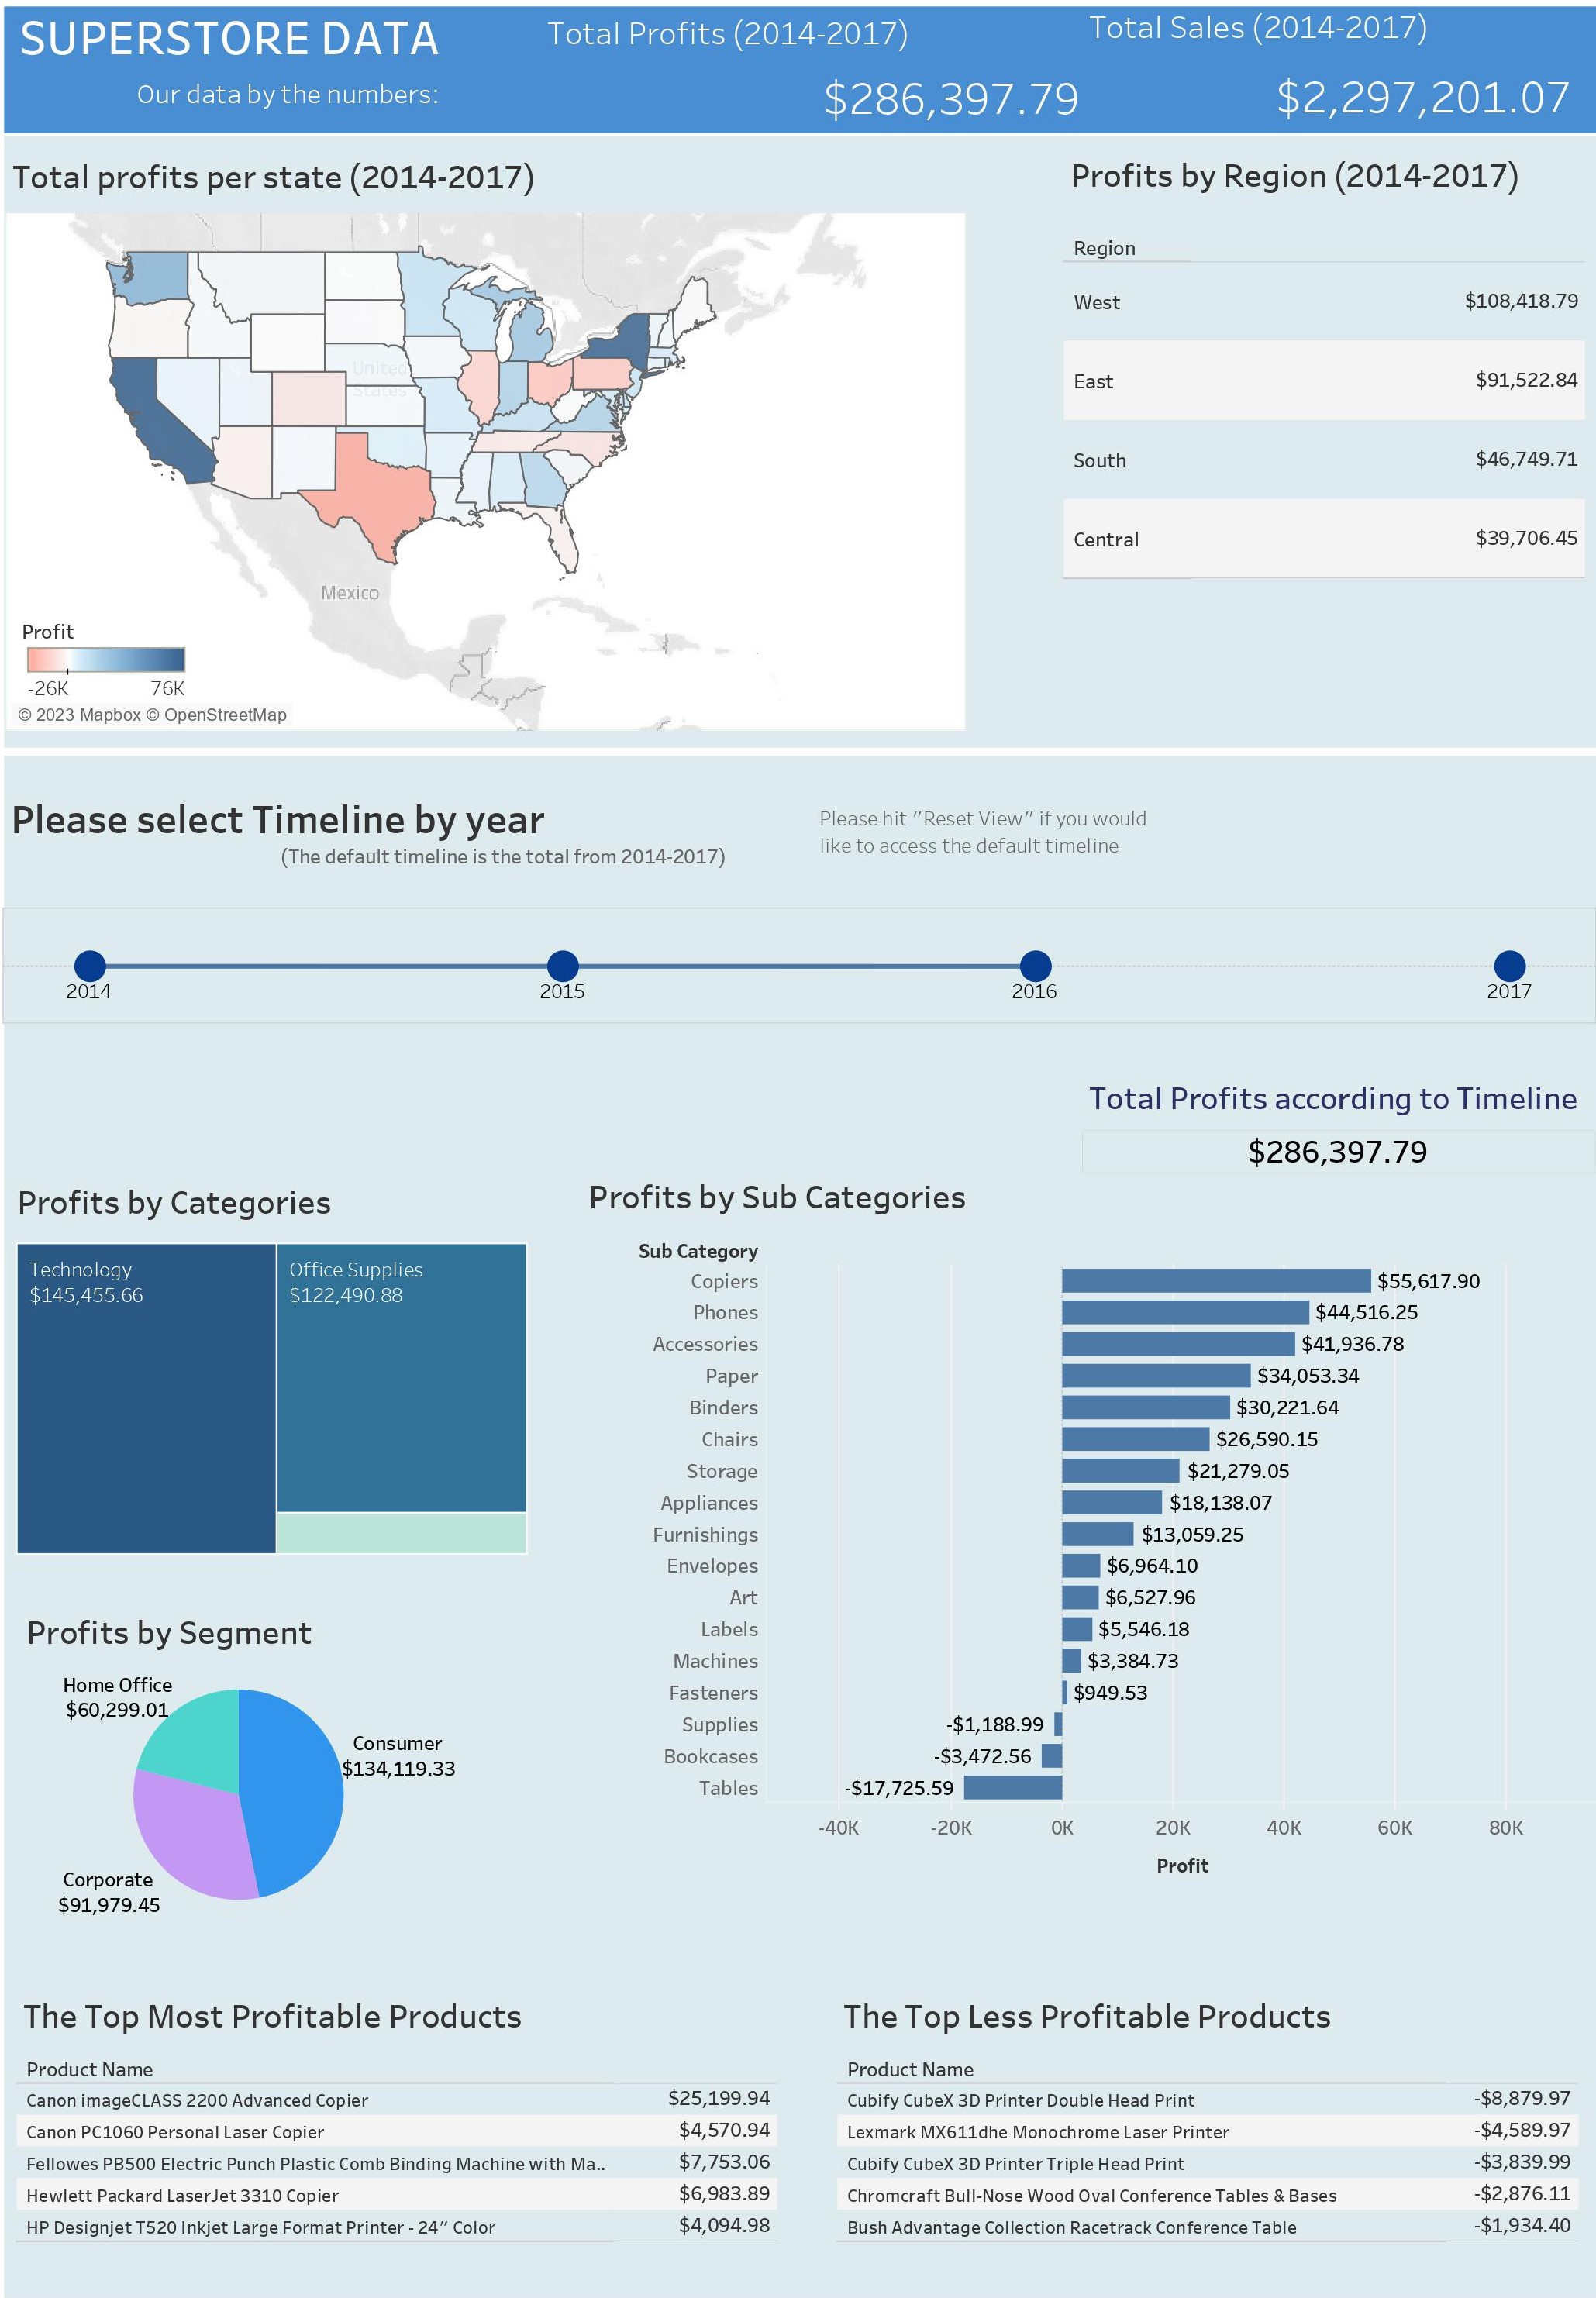
The deliverables include SQL analysis, a Tableau dashboard, and a written walkthrough. The dashboard is preserved here as an image because the original hosted Tableau view is no longer available.
The repository had 40 GitHub stars when checked on October 27, 2026.
05Practical value & limits
The analysis shows why a retail performance review should look beyond sales totals. A reasonable next step would be to examine discounts, shipping costs, and product mix within the loss-making subcategories before choosing an intervention.
The seasonal findings could inform planning discussions, while regional comparisons could guide more focused investigation. These are proposed uses of a sample-data analysis; the project does not demonstrate an implemented business change or measured profit uplift.
Keep exploring