Google Data Analytics capstone · 2022–2023
Same city.
Different riding habits.
Comparing casual riders and annual members to understand when they ride, how their trip durations differ, and what those patterns could mean for membership marketing.
01The analytical question
How do annual members and casual riders use a bike-share service differently? The Google Data Analytics capstone uses Divvy trip data to explore that question in a membership-growth scenario.
The goal is to make differences in behavior visible and identify useful starting points for marketing decisions. It is a certificate project using historical data, not a commissioned engagement with Divvy.
02Data & approach
The repository documents a twelve-month window from August 2021 through July 2022, with Excel and R used for analysis and a notebook developed in Kaggle.
- Define the comparison. Separate annual members from casual riders.
- Look across the year. Compare trip counts by month and rider type to identify seasonal differences.
- Look across the week. Compare average trip duration by weekday to understand how riding patterns change.
- Communicate visually. Use grouped charts to make differences between the two populations easy to compare.
03What the charts show
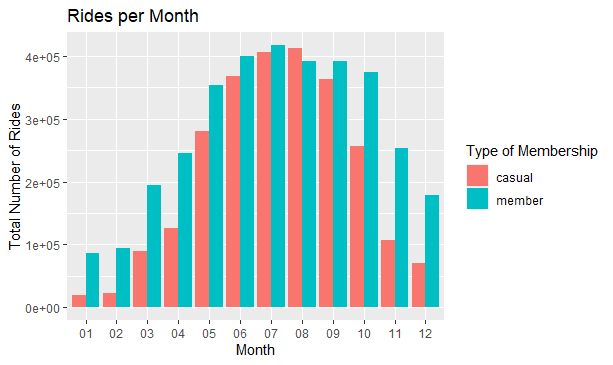
Both groups ride more in warmer months. The monthly chart shows the highest activity in July and substantially lower activity in winter. Member trips exceed casual trips in each month shown, with the gap narrowing in July.
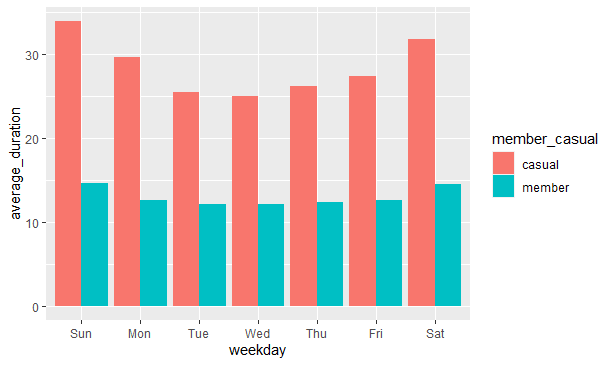
Casual rides last longer on average. The duration chart shows casual riders taking longer trips than members across every weekday. Casual trip duration is especially high on weekends.
The charts support these directional observations. Exact trip counts and duration values are not reproduced here because the full notebook and its data-cleaning record could not be independently inspected during the portfolio review.
04From patterns to useful questions
These patterns suggest a few testable ideas: focus membership messaging during the busy summer period, explore offers relevant to weekend casual riders, and account for seasonality when comparing campaign results.
Those are hypotheses to evaluate, not measured conversion outcomes. A follow-up analysis should segment casual riders more carefully and test whether repeated riding behavior predicts interest in a membership.
What this project demonstrates
Translating a broad business question into clear group comparisons, examining time-based patterns, and communicating results through readable visualizations.
05Original work
The original repository preserves the project overview and visualization files. The Kaggle link points to the notebook associated with the project.
Keep exploring