Udemy coursework · Portfolio updated March 2023
Learning the methods.
Seeing the tradeoffs.
Selected coursework exploring historical financial data, regression, and neural networks. Each exercise is presented with its original learning context.
01Stock-market visualizations
Question: How did major bank stocks behave across a period that included the financial crisis?
A finance capstone from the Data Science and Machine Learning course explores Bank of America, Citi, Goldman Sachs, JPMorgan Chase, Morgan Stanley, and Wells Fargo from January 2006 to January 2016.
The notebook uses pandas, Matplotlib, and Seaborn to examine closing prices, returns, rolling averages, and correlations. The deliverable is a set of historical visualizations that supports comparison across the six securities.
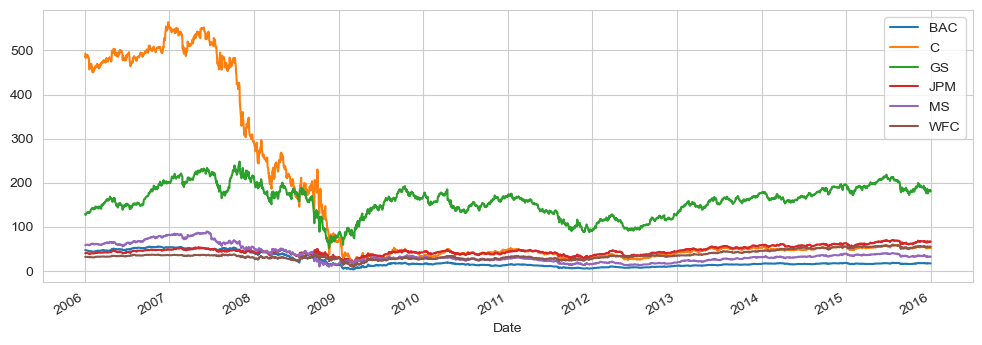
Analytical value: Practice working with time-indexed data and distinguishing price levels from returns. A raw-price chart is useful for inspecting each series, while normalized prices or returns make relative-performance comparisons more meaningful.
02Ecommerce regression
Question: Which recorded customer behaviors are associated with annual spending in a synthetic ecommerce dataset?
This course exercise fits a linear-regression model using session length, time on an app, time on a website, and membership length. It uses a train/test split, predicted-versus-actual comparisons, and residual analysis.
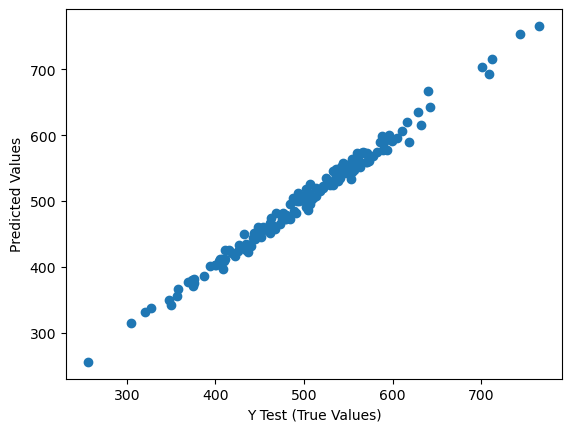
The notebook reports a mean absolute error of approximately 7.23 and a root mean squared error of approximately 8.93 in the dataset’s annual-spending units. Membership length and app time have larger fitted coefficients than website time in this particular model.
Analytical value: Connecting regression output to a business question while checking prediction errors. These associations do not establish that investing in an app will cause spending to rise; the dataset is synthetic, and the exercise is not evidence of a real client outcome.
03Loan repayment with Keras
Question: How can a neural-network classifier model loan repayment outcomes, and how should its errors be evaluated?
This guided TensorFlow/Keras code-along uses a LendingClub loan dataset. It covers data preparation, feature encoding, model training, and evaluation of repayment predictions.
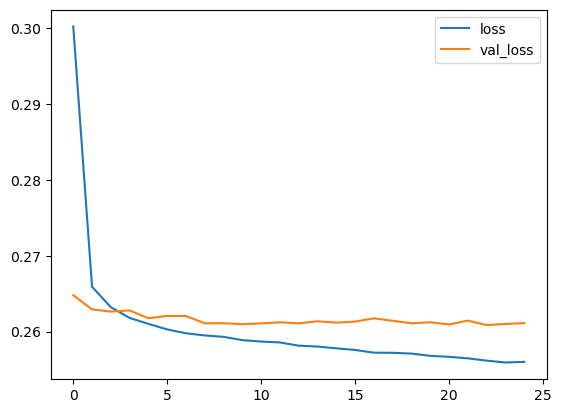
The notebook reports roughly 89% overall accuracy, but recall for class 0 is about 44%. That imbalance illustrates why a single accuracy score can hide important classification errors.
Analytical value: Learning the neural-network workflow and interpreting training curves and class-level metrics. This is coursework, not a lending decision system, and no production use is claimed.
04Course context & original work
These notebooks come from the Python for Data Science and Machine Learning course, including guided exercises and a deep-learning code-along. The course materials are credited to their original instructors; my repositories preserve the completed learning work.
A separate Python for Finance course repository contains additional exercises in investment fundamentals and data analytics.
Keep exploring